Course analytics
How to read Insights for one course: viewers, completion, drop-off by screen, and per-learner activity.
Open Insights on the course to see how many people viewed it, your completion rate, where learners drop off through the course, and a per-learner breakdown of time spent and progress, all for a date range you choose.
Course analytics tell you whether one course is working: how many people are getting through it, and where they're getting stuck. You read this through Insights on the course.
How do I open Insights for a course?
- Select Courses from the navigation menu on the left of your workspace.
- If your course is in a folder, open that folder.
- Find the course you want and open Insights from its card:
- New builder courses: select the Insights button (the chart icon) on the card, below the course title.
- Classic courses: click the Insights button on the card.
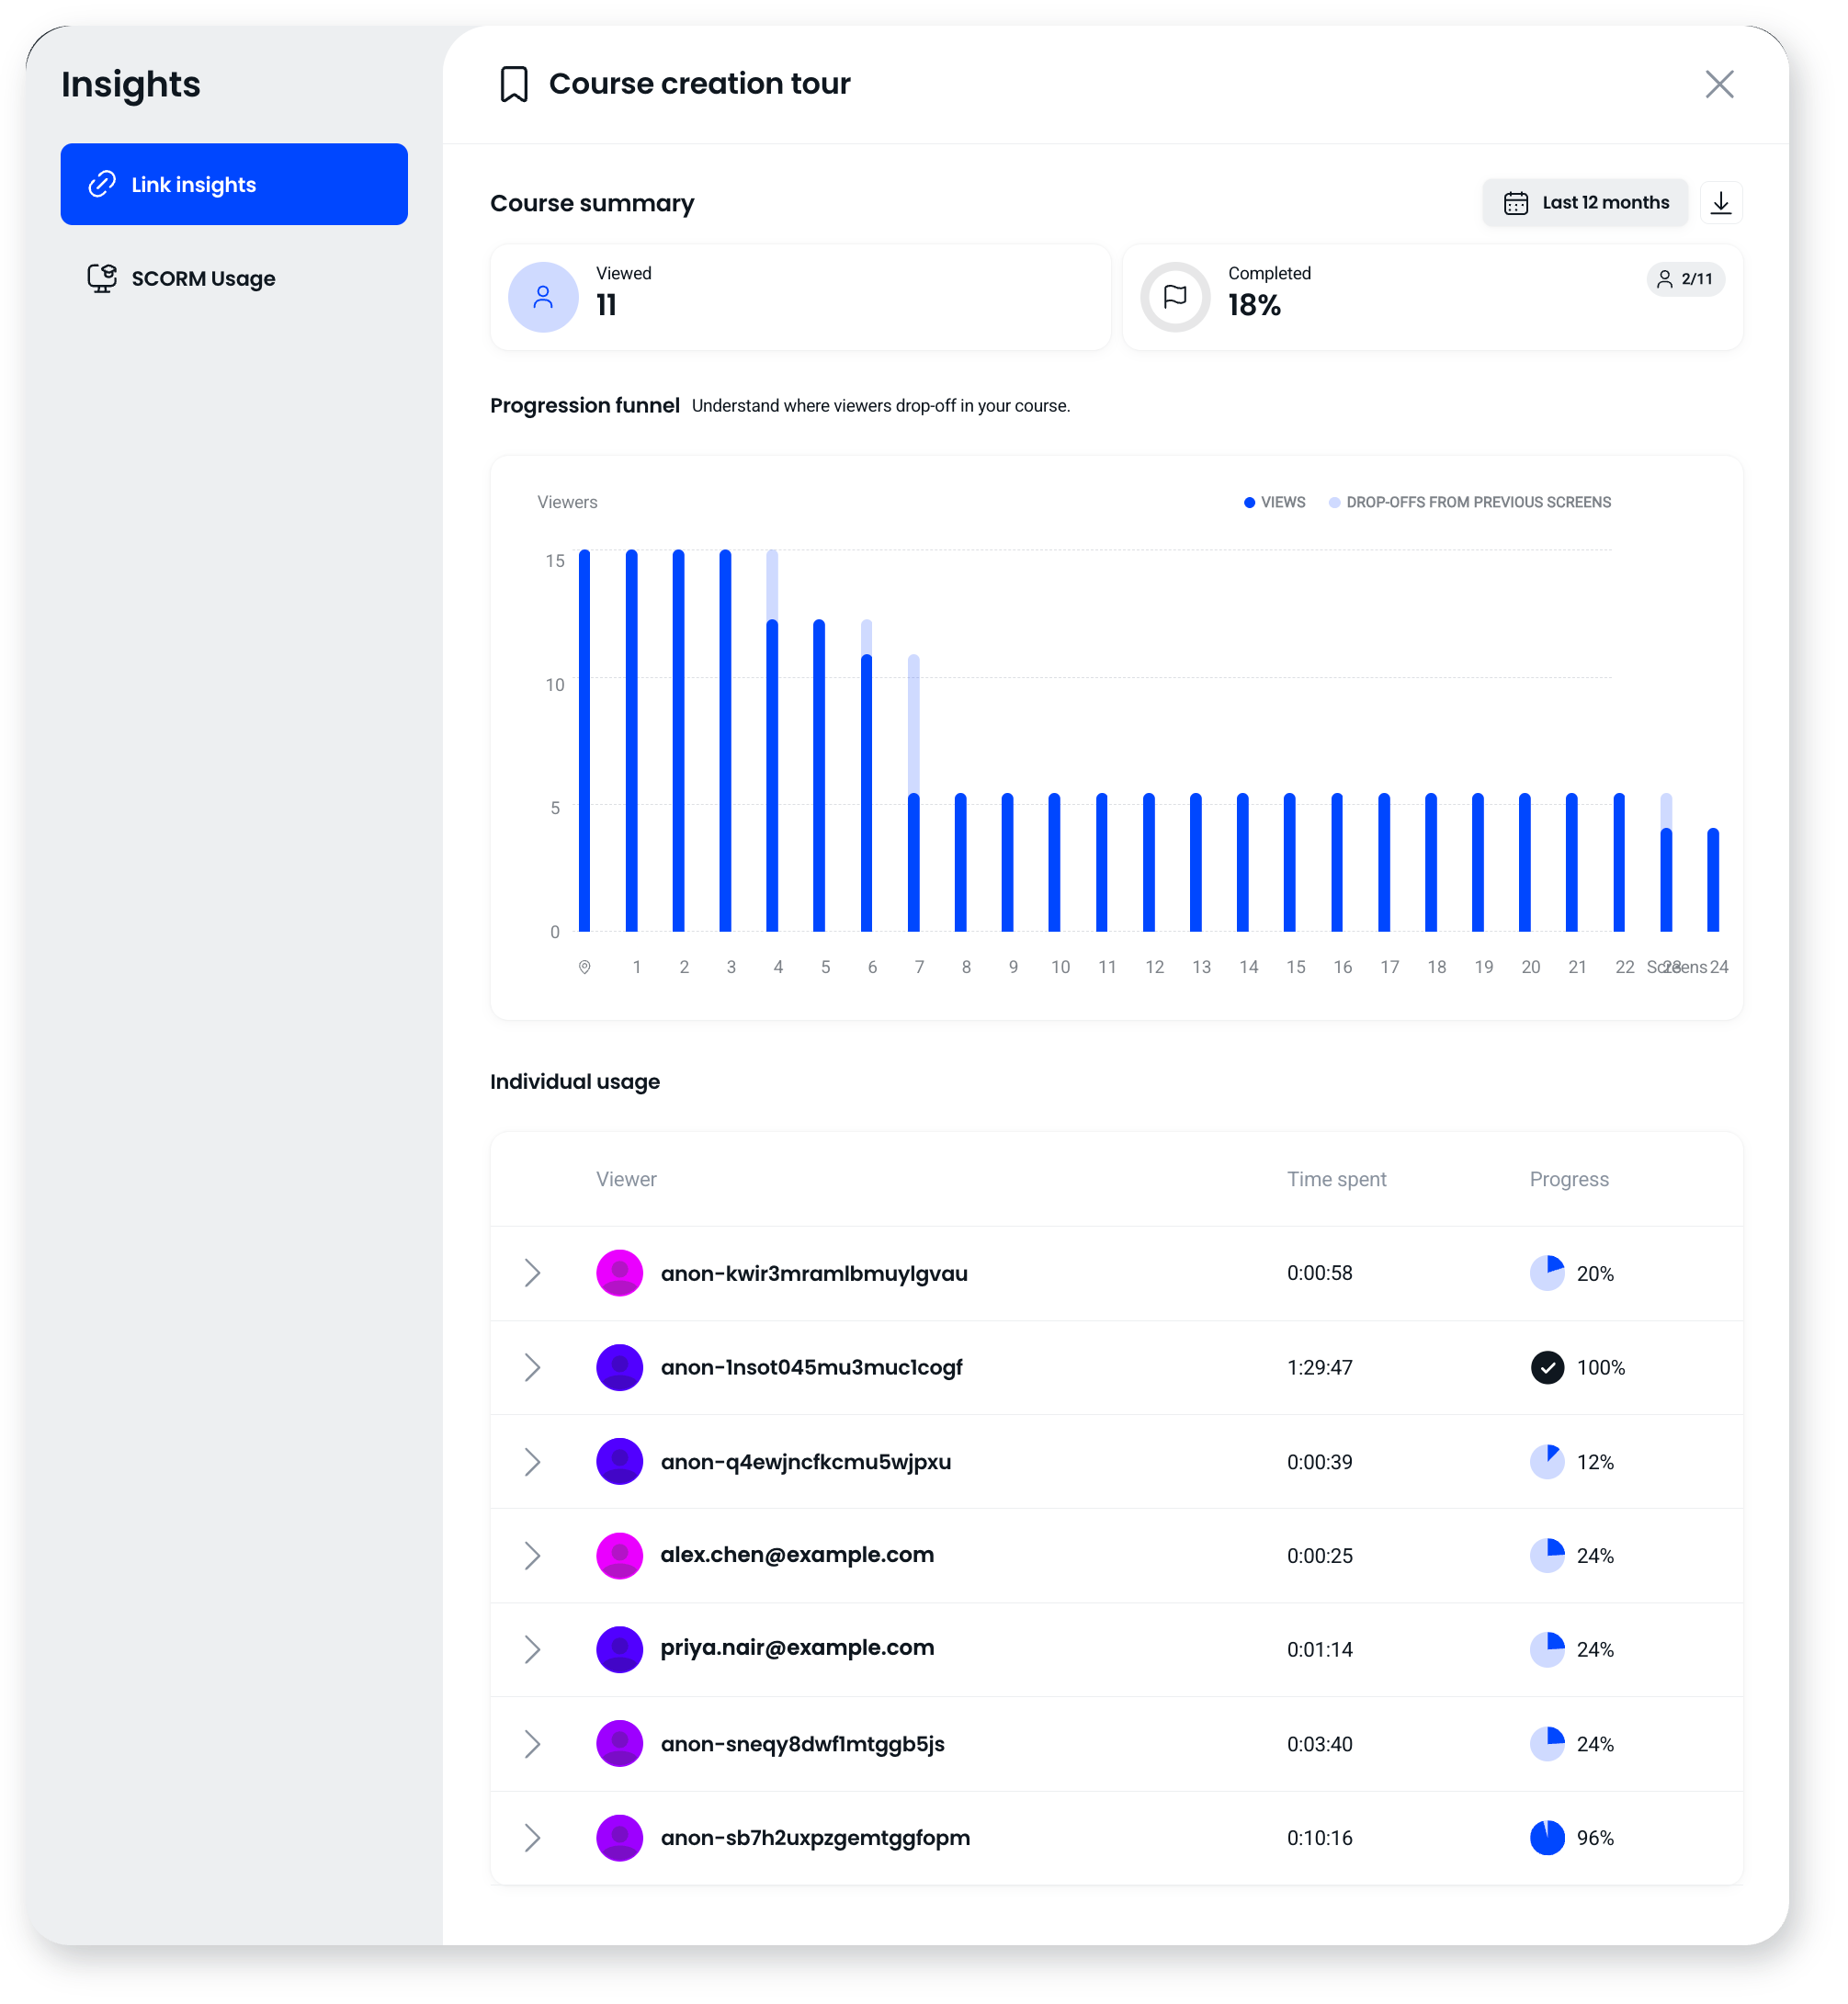
- The Insights panel opens on the Link insights tab, which covers people who opened the course through a Coassemble share link. Set the date range at the top to the period you want to look at.
If you don't see any data yet, you'll see No results found. Insights only start collecting once people open the link.
What can I see?
Insights bring together three views of the course:
- Course summary. The headline numbers for your date range: the total number of viewers and the overall completion rate.
- Progression funnel. How many people make it through each screen of the course, so you can see where they drop off. Hover over a bar in the chart to see the exact number of viewers at that screen. If a lot of learners leave at the same screen, that's the part to rework, for example by shortening it or making it more interactive.
- Individual usage. A per-learner list showing who viewed the course, how long they spent in it, and their progress. On a knowledge check screen, select Details to see each question answer (right first try, wrong then right, or skipped) and export them as a CSV.
Can I filter by date range?
Yes. Use the date selector at the top of Insights to focus on a period, for example the last 7 days, last 30 days, last 3 months, all time, or a custom range. The summary, funnel and individual usage all update to match, so you can compare a recent period against an earlier one and see whether changes you've made are helping.
Can I ask the agent instead?
Yes, in the new builder. The AI agent in the new builder has its own Insights tab, which reads the same course data. You can ask it questions in plain language, like where people are giving up or which questions are being failed, and it answers from the numbers for the course you have open. Because it sits in the builder, the same conversation that finds a weak screen can rewrite it for you. The agent isn't available on the legacy Flow plan.
Nothing shows in the agent's Insights tab until a few learners have been through the course, since there's nothing to read yet.
How do I read the results?
Start with the summary to see whether enough people are completing the course. If completion is low, use the progression funnel to find where they're dropping off, then look at individual usage to see whether it's a broad pattern or a few specific learners.
How is this different from the other reporting views?
Coassemble reports on courses in three different situations, and it's worth knowing which view answers which question:
- Link insights cover people opening a course through a Coassemble share link.
- SCORM usage covers a course you exported as a SCORM package and uploaded into another system, like your own LMS. It shows where the package is being used and how many people opened it there.
- Hosted SCORM reporting covers a third-party SCORM package you brought into Coassemble and run here. That's tracked by attempt, including time spent, success, score and question-level results.
The distinction that catches people out is the middle one against the last. SCORM doesn't necessarily mean the course lives somewhere else: a package can run inside Coassemble too, and that case is reported on differently.
Can I show course analytics in my own product?
If you deliver the course through Embed, you can surface the same kind of data inside your product. There's a read-only Course Analytics component you can embed for a specific course, and you can pull the underlying numbers through the tracking API to build your own dashboards.
Frequently asked questions
What does the completion rate measure?
The share of viewers who finished the course, for the date range you've selected. Changing the date range changes the number.
How do I find where learners give up?
Use the progression funnel. It shows how far people get through the course screen by screen, so the point where numbers fall away is where learners are dropping off. In the new builder, you can also ask the agent's Insights tab in plain language and it will tell you.
Will I see individual learners by name?
Only if their identity was captured when they took the course. Anonymous activity is counted in your totals but isn't tied to a named person.
Can I see this inside my own product?
Yes, with Embed. Use the read-only Course Analytics component for a specific course, or pull the data through the tracking API.
Why don't I see any data?
Insights only start collecting once a course has been opened through a shared link. If you've just shared it, give it time, or check you've shared the link at all. It's also worth checking the date filter.
What if the SCORM package is hosted in Coassemble rather than exported?
That's reported separately again, by attempt: attempts, time spent, success, score, and question results you can download as a CSV.