Developer console
The in-app console for getting started with the Coassemble API, watching your traffic, tracking usage, and managing API keys.
What is the Developer console and when would I use it?
The Developer console is where you set up, monitor and manage your integration from inside Coassemble. Open it when you are wiring Coassemble into your own product for the first time, checking that the API is healthy, tracing a specific request or client, or keeping an eye on usage against your allowance.
It sits alongside the full developer documentation at developers.coassemble.com, which covers the API reference, embeddables, events, webhooks, and errors and rate limits. The console is the operational view. The developer docs are the reference. Each tab has a Developer docs panel at the bottom that links straight to the relevant guide.
The console has up to six tabs: Overview, Requests, Webhooks, Clients, Usage, and API keys. Clients appears once your workspace has its first client identifier.
Who can see the Developer console?
Only people in your workspace with the Owner, Admin or Developer role see the Developer console. Creators do not see it.
Legacy accounts that do not have API access do not have the Developer console at all. If you are on an older plan and cannot see the Developer option in Coassemble, that is why.
Overview
How to start
When your workspace is new to the API, the Overview tab opens with a How to start guide. It gives you four ways in, so you can pick the one that suits how you work:
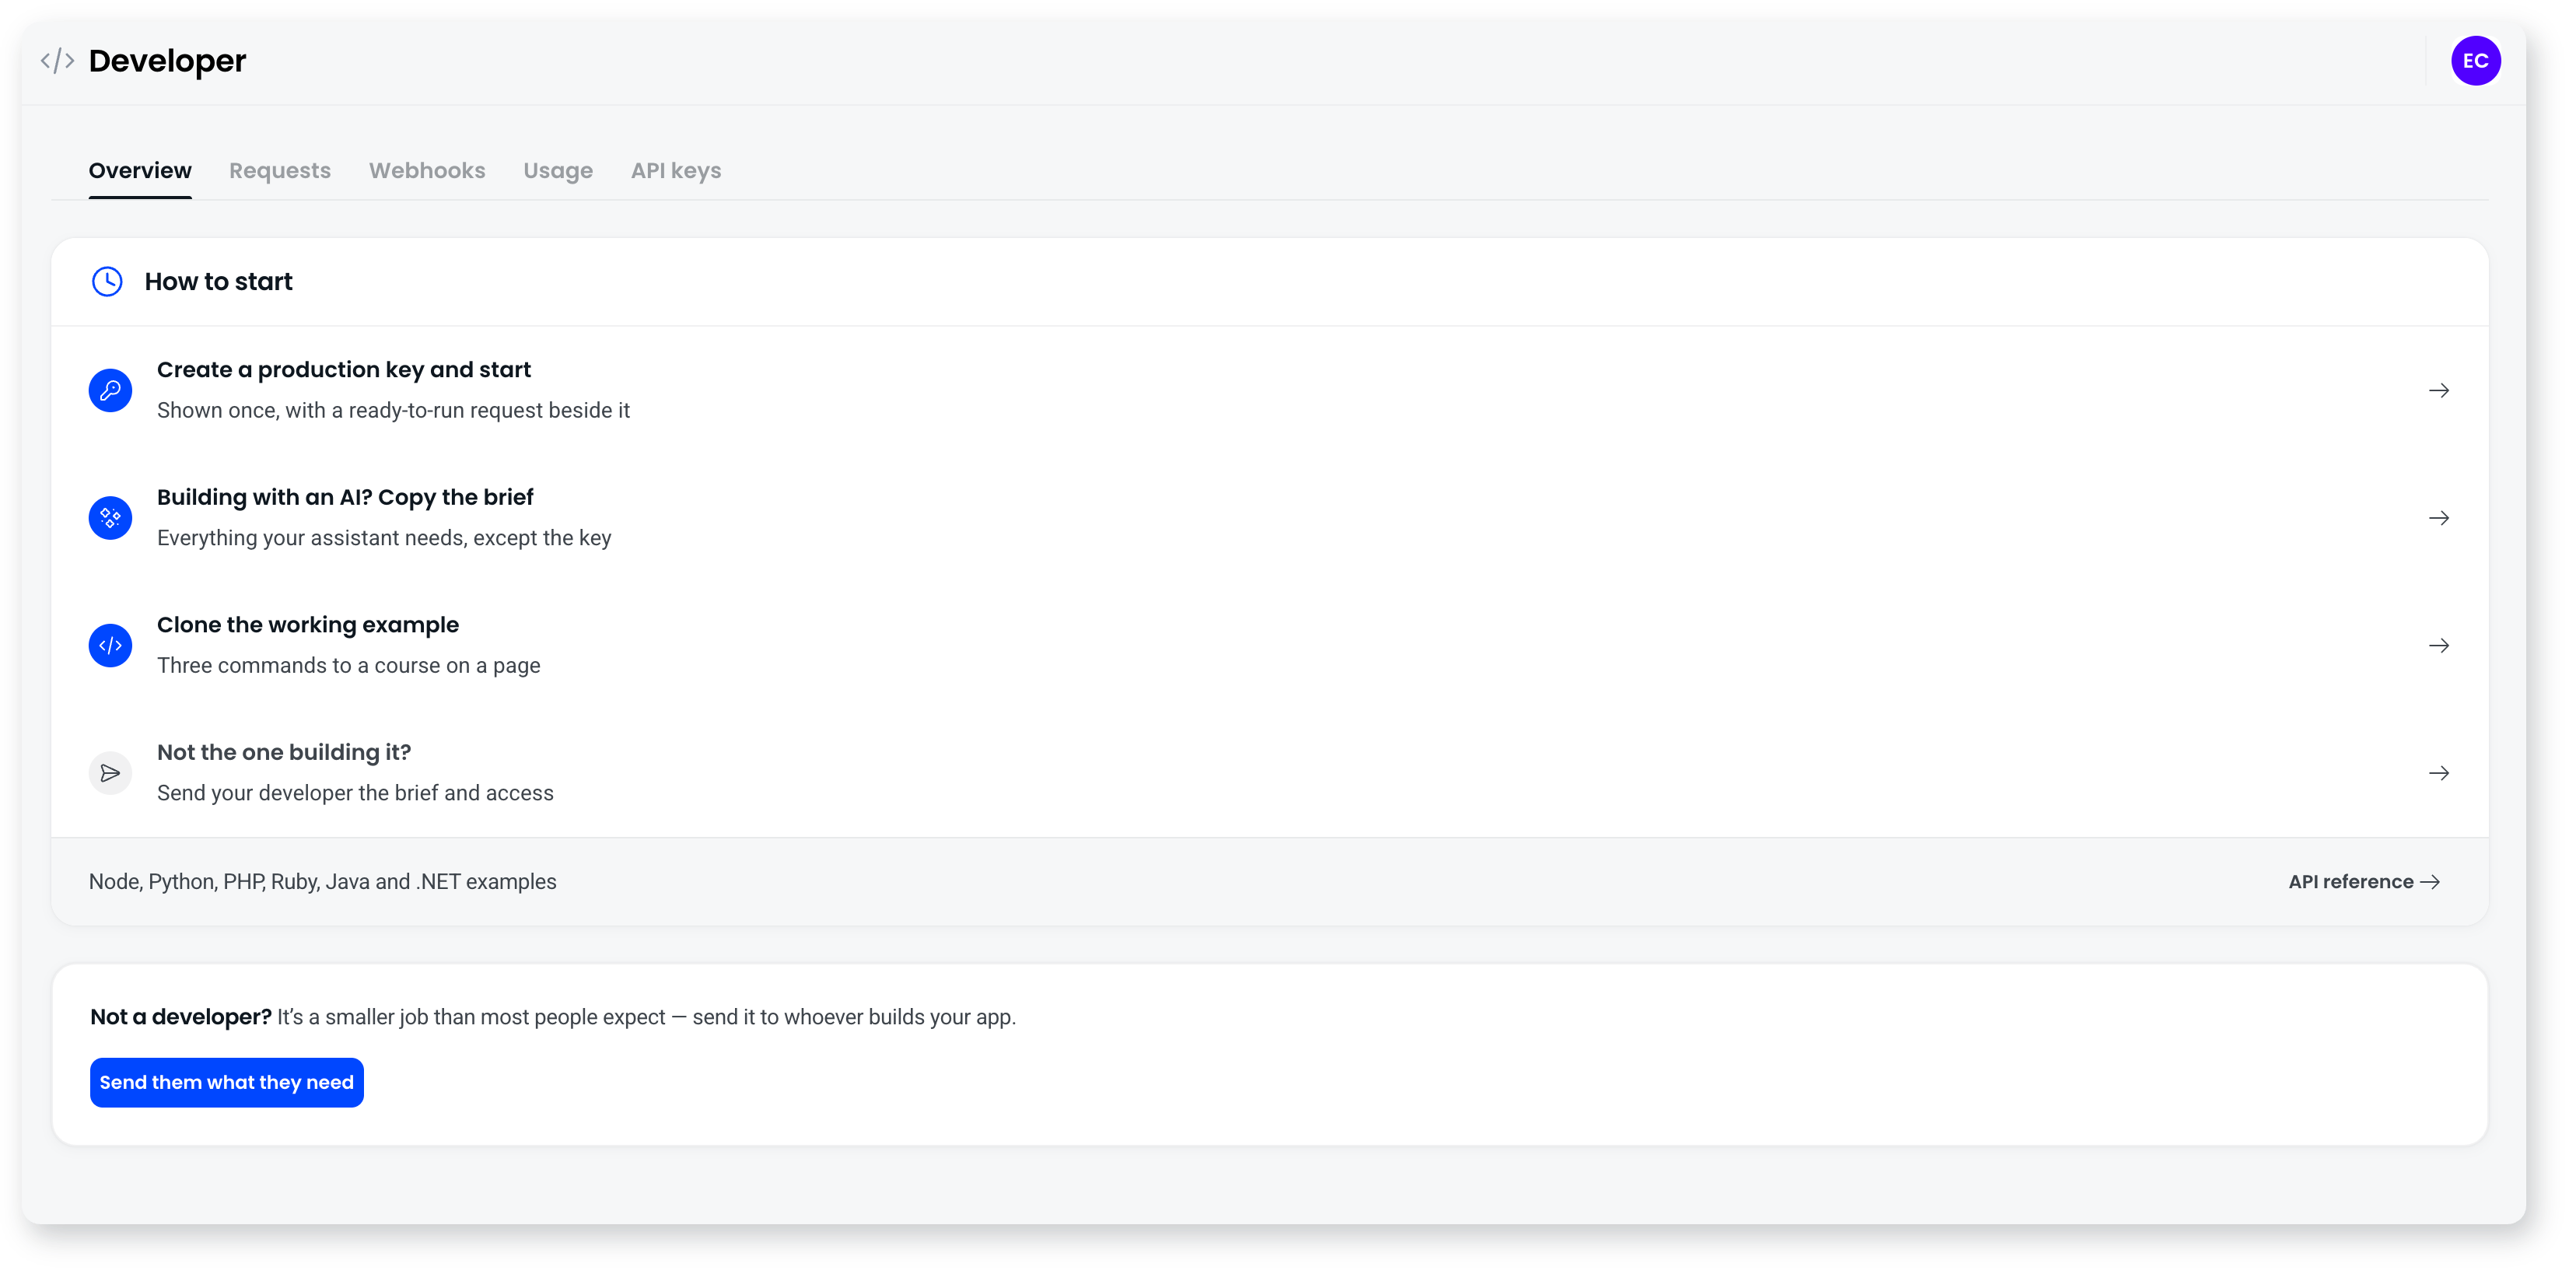
- Create a production key and start (or Create a test key and start, if your workspace issues test keys). Creates an API key and shows it once, with a ready-to-run request beside it so you can make your first call straight away.
- Building with an AI? Copy the brief. Opens a brief you paste into Claude, Cursor or ChatGPT next to your own code. It has everything your assistant needs to build the integration except your key, which you keep out of the chat.
- Clone the working example. A small working integration you can run with three commands: one serverless function that holds your key, and one page that shows your course. If you are using an assistant, tell it to adapt the example to your stack.
- Not the one building it? Sends your developer the brief and access, so the person who builds your app has what they need. The Send them what they need button below the guide does the same thing.
Examples are available in Node, Python, PHP, Ruby, Java and .NET, and API reference takes you to the full reference in the developer docs.
Once you have a key, the steps on the Overview tab tick off as your integration makes its calls, so you can see how far you have got.
Health dashboard
Once your integration is up and running, the Overview tab is a health dashboard for your traffic. It shows:
- Requests in the last 24 hours, with the previous 24 hours next to it for comparison.
- Errors as a share of requests in the last 24 hours, excluding 404s, compared with your 30-day average, so noise from missing paths does not drown out real problems.
- p95 latency, the response time that 95% of requests came in under.
- Webhooks delivered, so you can see delivery is flowing.
- A requests and errors chart across the recent window.
- Recent failures grouped by endpoint, so a spike shows up as a single row rather than a wall of individual errors.
The tab also surfaces a short attention list at the top when it spots something worth looking at, such as a jump in errors, a webhook endpoint that has stopped delivering, or your AI allowance running low. When traffic is quiet and nothing needs a look, that space stays clear instead of showing empty charts.
When you'd use it: to get your first integration working, as your first check when something feels off, or as a quick daily glance to confirm the integration is behaving.
Requests
The Requests tab is a searchable log of every call made against your API keys. Each row shows the time, the request (method and path), the status code, the duration, the client identifier, and the request ID.
Filters:
- Time range, starting at the last 24 hours
- Status (for example, only 4xx or only 5xx)
- Path contains (free-text match on the path)
- Client identifier (narrow to one integration or one customer)
- Hide 404s, on by default
Open any row to see the request detail, including why a call was refused when that is the reason for the status. A response that would otherwise read as a bare error code is explained in plain words, for example that a feature is not enabled for the workspace, so refusals do not look like faults in your integration.
You can export the filtered log with Export CSV. Requests are retained for 30 days.
The request ID is the same ID Coassemble returns in the x-request-id response header, so you can match a row in the log against your own logs.
When you'd use it: tracing a specific failure a customer reported, checking what a particular client identifier is doing, or pulling a slice of traffic out as CSV for a deeper look.
Webhooks
The Webhooks tab is where you manage the endpoints Coassemble posts events to, and watch what happens to each delivery. Add a new endpoint with Add webhook. The tab has two parts.
Your endpoints. The list of subscriptions for your workspace: the endpoint URL and the events it is subscribed to. Each endpoint has a signing secret so you can verify that a delivery genuinely came from Coassemble. It's shown once, when you add the webhook or rotate the secret, so store it straight away. Every request Coassemble posts is signed, and the developer docs at developers.coassemble.com cover the delivery headers and the exact signature check.
Delivery history. Each attempt against each endpoint, with the status code we got back and how many attempts it has taken. When a delivery fails, you can replay it, either one at a time from its row or in bulk for a whole batch of failures, which is what you reach for when your endpoint has been down for a stretch and you want the missed events to catch up.
Choosing events. When you add or edit a webhook, you pick the events it is subscribed to from the full list Coassemble sends.
The full event catalogue and payload shapes live in the developer docs under Events and Webhooks at developers.coassemble.com.
When you'd use it: setting up a new subscription, checking your endpoint is receiving deliveries, replaying deliveries after an outage on your side, or picking up the signing secret to verify signatures.
Usage
The Usage tab shows what your workspace is consuming against its AI allowance, and what each of your clients is using. A client identifier is how you tell Coassemble which of your customers a request is for, so this tab is also the way to see any one of them at a glance. What it shows depends on how your workspace is set up. Alongside the parts below, it can also show your recipient allowances.
AI allowance. How much of your workspace's AI allowance has been used, with the date it next resets:
- Narration
- Images
The figures cover your own team and all of your clients together, because they all draw from the same workspace allowance.
Select Edit default usage caps for clients to set the narration and image caps that new clients start with, or to apply them to every existing client.
Clients. A table of your client identifiers showing, for each one:
- Creators
- Narration
- Images
- Standing (a health indicator for that client)
Use Find a client identifier to jump straight to one client, and sort the table by when each client was last updated. The client count sits at the top right of the table.
For the concept behind client identifiers and how they attach to requests, see "How identities work" in the developer docs at developers.coassemble.com.
When you'd use it: checking how close you are to your AI allowance, working out which client is driving the most usage, changing the caps new clients start with, answering a support question from one of your customers, or confirming a new client identifier is being picked up.
The specific numeric allowances that appear here depend on your plan. This article does not list plan-by-plan limits. Check your workspace's Usage tab for the current figures.
API keys
The API keys tab is where you create, name, and manage the keys you use to authenticate to the Coassemble API. A workspace can hold as many keys as it needs, so you can name one per integration and revoke any of them without disturbing the others.
The table lists each key with:
- Name
- Key (shortened to its first few characters so you can tell them apart, with a Test or Production label)
- Created date
- Last used date
- Status (Active, Not yet in use, or Revoked)
Create a key with Create key, and copy it straight away, because the table only ever shows the masked version afterwards. Revoke a key from the same tab as soon as it is no longer in use. A revoked key stops working immediately, so when you are rotating rather than retiring, deploy the replacement and confirm the old key has stopped being called before you revoke it.
For how requests are counted and throttled, see "How rate limits work" in the developer docs at developers.coassemble.com.
When you'd use it: issuing a key for a new integration, checking a key's last used date before retiring it, or rotating a key that has been in place a while.
Where the full developer documentation lives
The full API reference, embeddables, events, webhooks, identities, and errors and rate limits guides live at developers.coassemble.com. The Developer console is the in-app companion to those docs.
Frequently asked questions
Where did the Clients tab go?
Clients has its own tab, which appears once your workspace has its first client identifier. The Usage tab also lists each client's creators, narration, images and standing.
I'm not a developer. What should I do?
Select Send them what they need on the Overview tab. It sends whoever builds your app the brief and access they need, and it's a smaller job than most people expect.
Does the console show usage in real time?
The Overview counters use a rolling 24-hour and 30-day window, and the Requests log shows individual calls as they land. The Usage tab shows your AI usage against your workspace's allowance.
Can I export data from the console?
Yes. The Requests tab has a CSV export of the filtered log.
How long is request history kept?
The Requests log holds the last 30 days of calls. Older requests fall off as new ones come in.